Step 01Setup
Capture
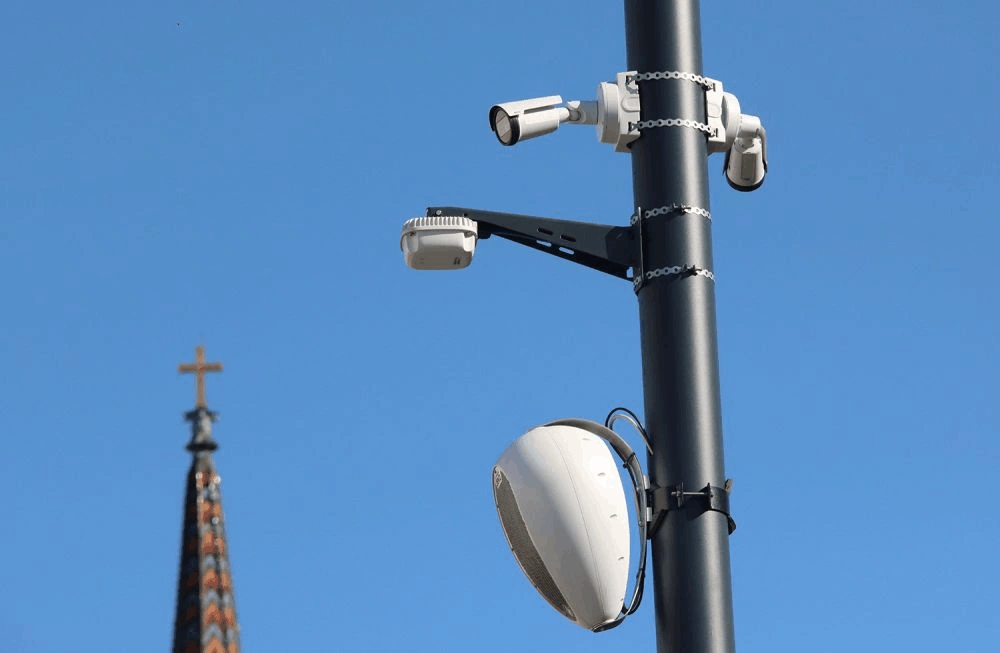
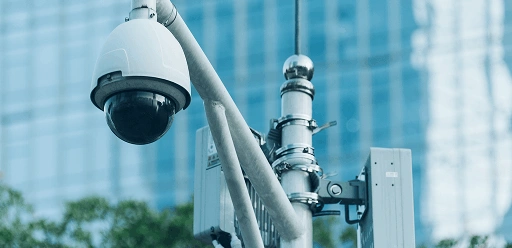
We use the cameras at your junctions and corridors — existing or new. They feed trafficNET; nothing changes for road users, and there's no disruptive roadwork to install sensors.
Intelligent traffic monitoring. Computer vision and predictive analytics that map how vehicles and pedestrians really move — so cities optimise mobility on real data.
trafficNET precisely monitors vehicle and pedestrian movement with computer vision and analytics, enabling more efficient planning of traffic infrastructure and optimised flow across the city.
We use the cameras at your junctions and corridors — existing or new. They feed trafficNET; nothing changes for road users, and there's no disruptive roadwork to install sensors.
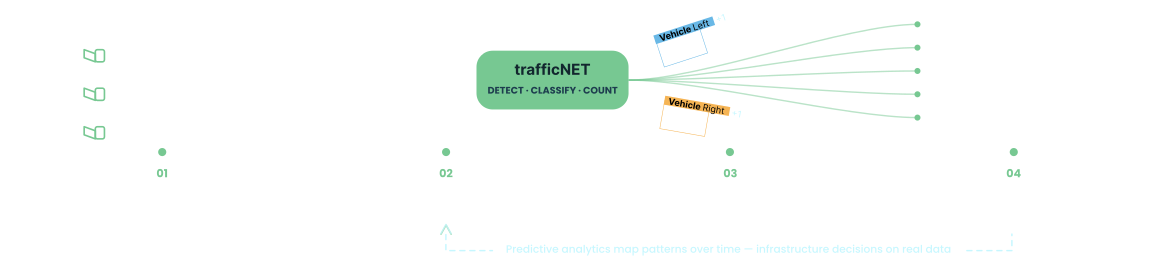
Computer-vision algorithms detect and classify vehicles and pedestrians precisely, tracking each one's movement — counts, types and turning movements, junction by junction.
Predictive analytics map traffic patterns over time — volumes, turning movements, pedestrian flows and congestion — so you see how the network really behaves, not a snapshot.
Planners make better infrastructure decisions and tune flow on real data: retiming signals, easing congestion and improving pedestrian safety across the city.
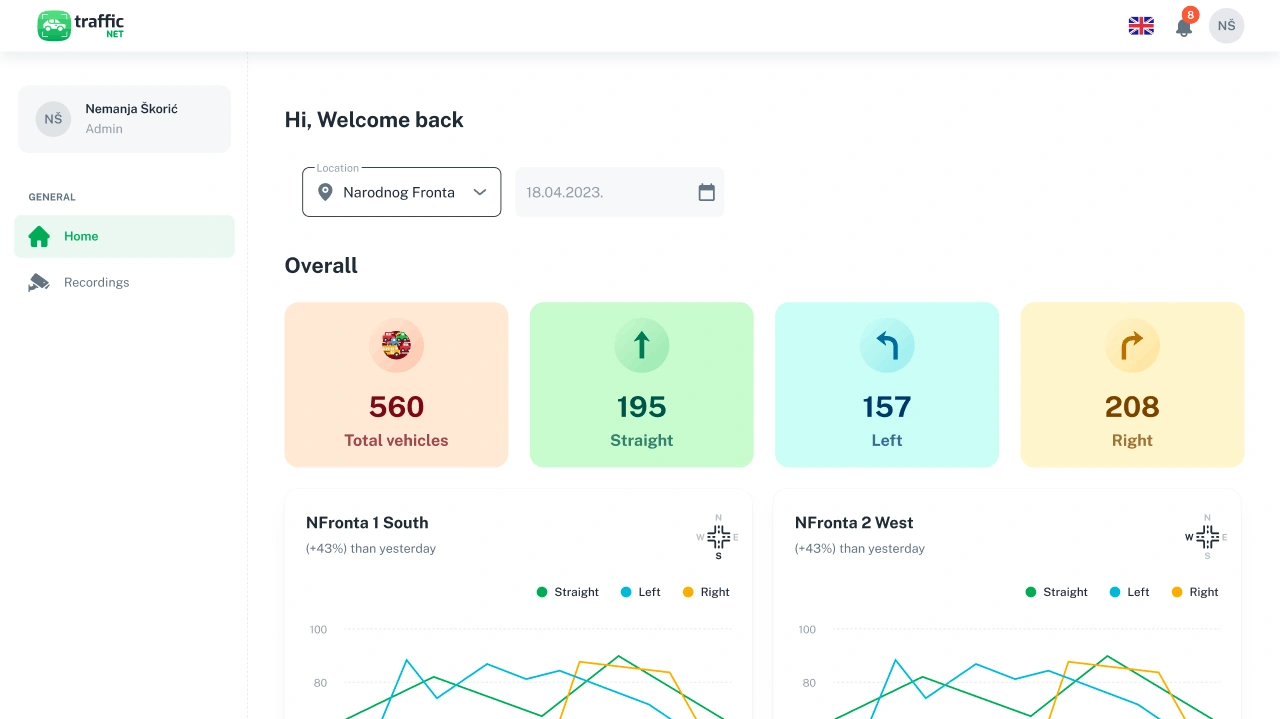
From the live dashboard — totals, turning-movement splits and flow over time, per junction — to the computer vision detecting and classifying every vehicle, these are the screens your mobility and planning teams use.
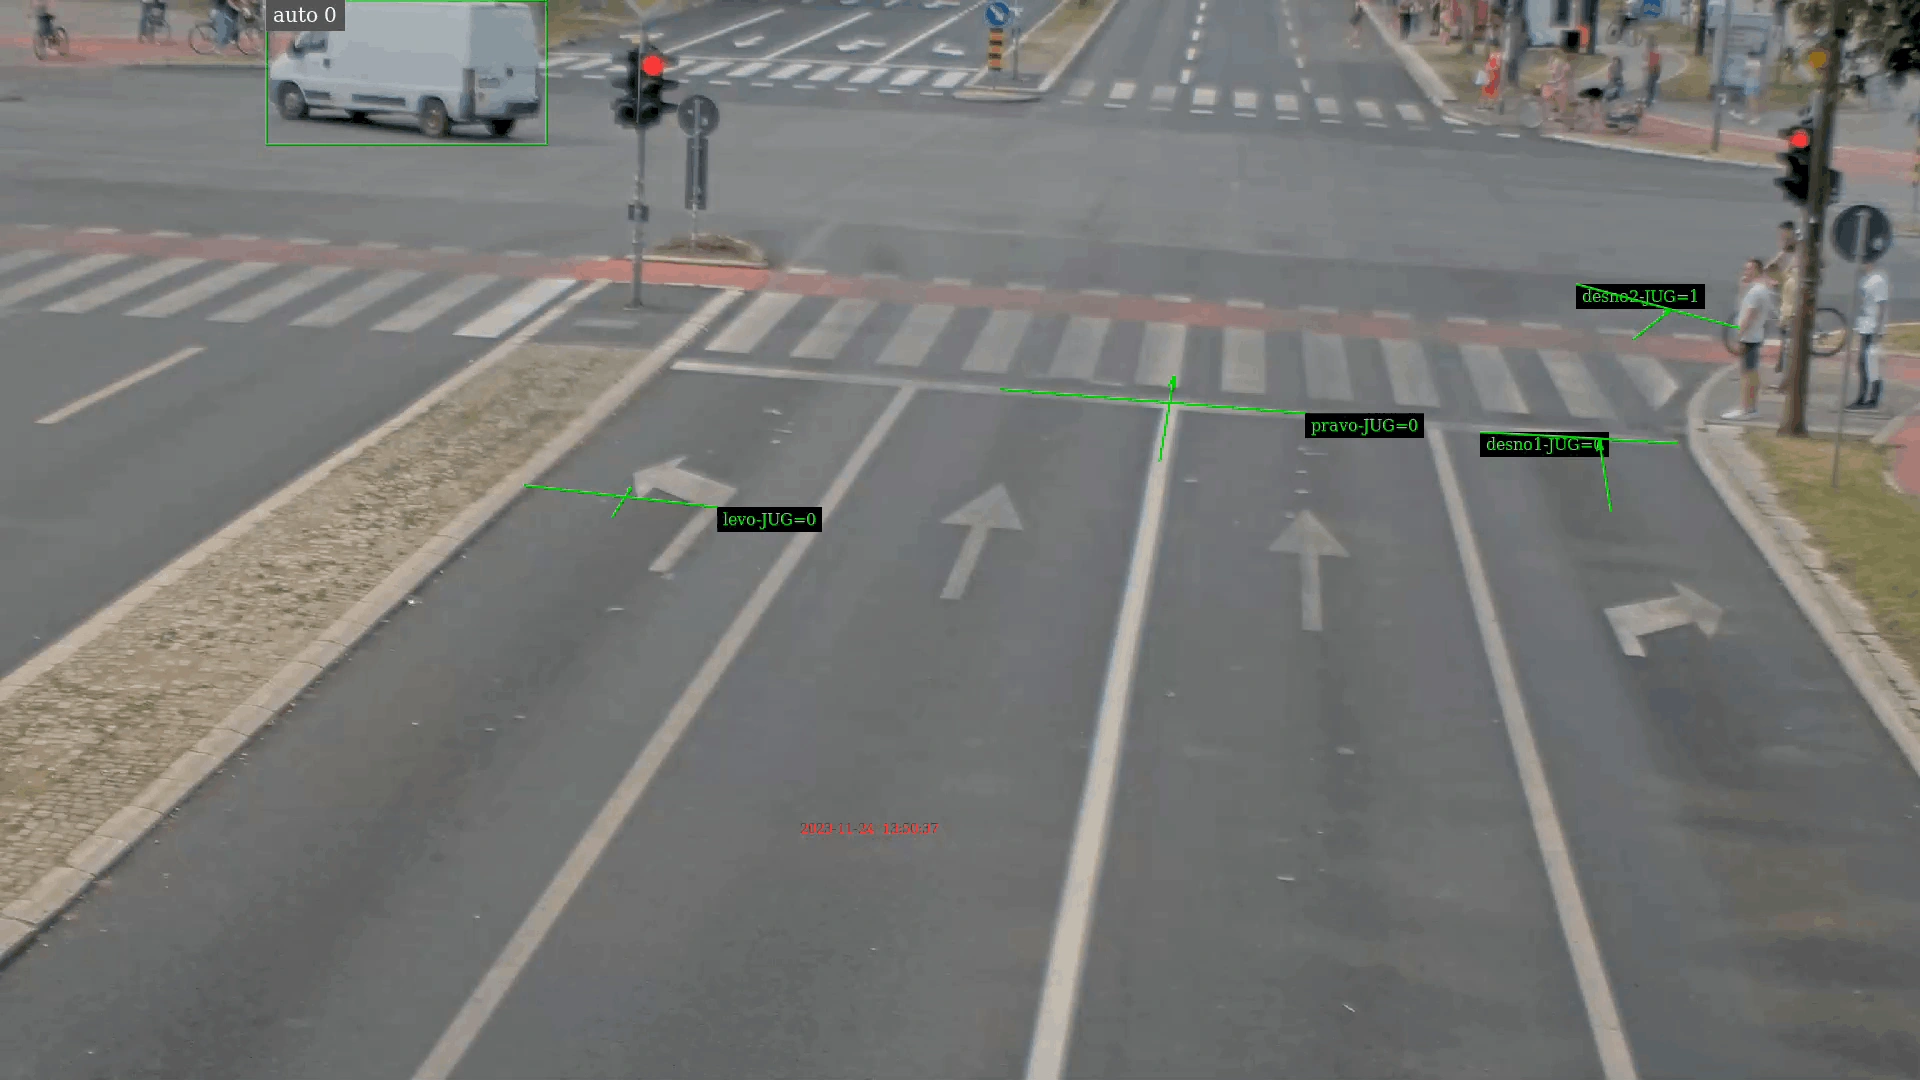
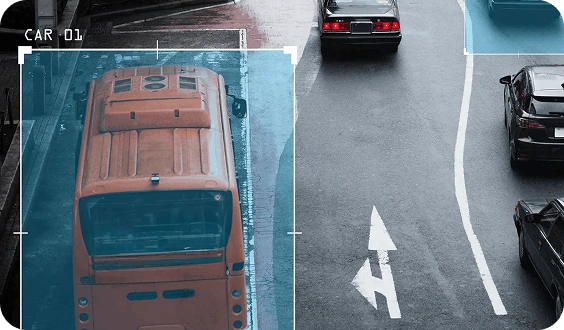
trafficNET reads from your existing IP / CCTV and traffic cameras, processes them with computer vision, and feeds anonymous counts and analytics into your management centre, displays and planning tools.
Junction, corridor or city-wide? trafficNET scales from a single intersection to a whole network. Bring your priority sites to the discovery call.
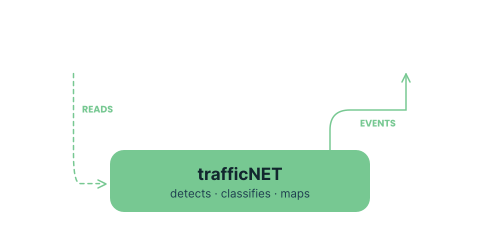
Cameras
IP / CCTV you already run
trafficNET
Computer vision + predictive AI
Dashboard — API
Volumes · turning movements · patterns
Your planners
Signals — safety — infrastructure
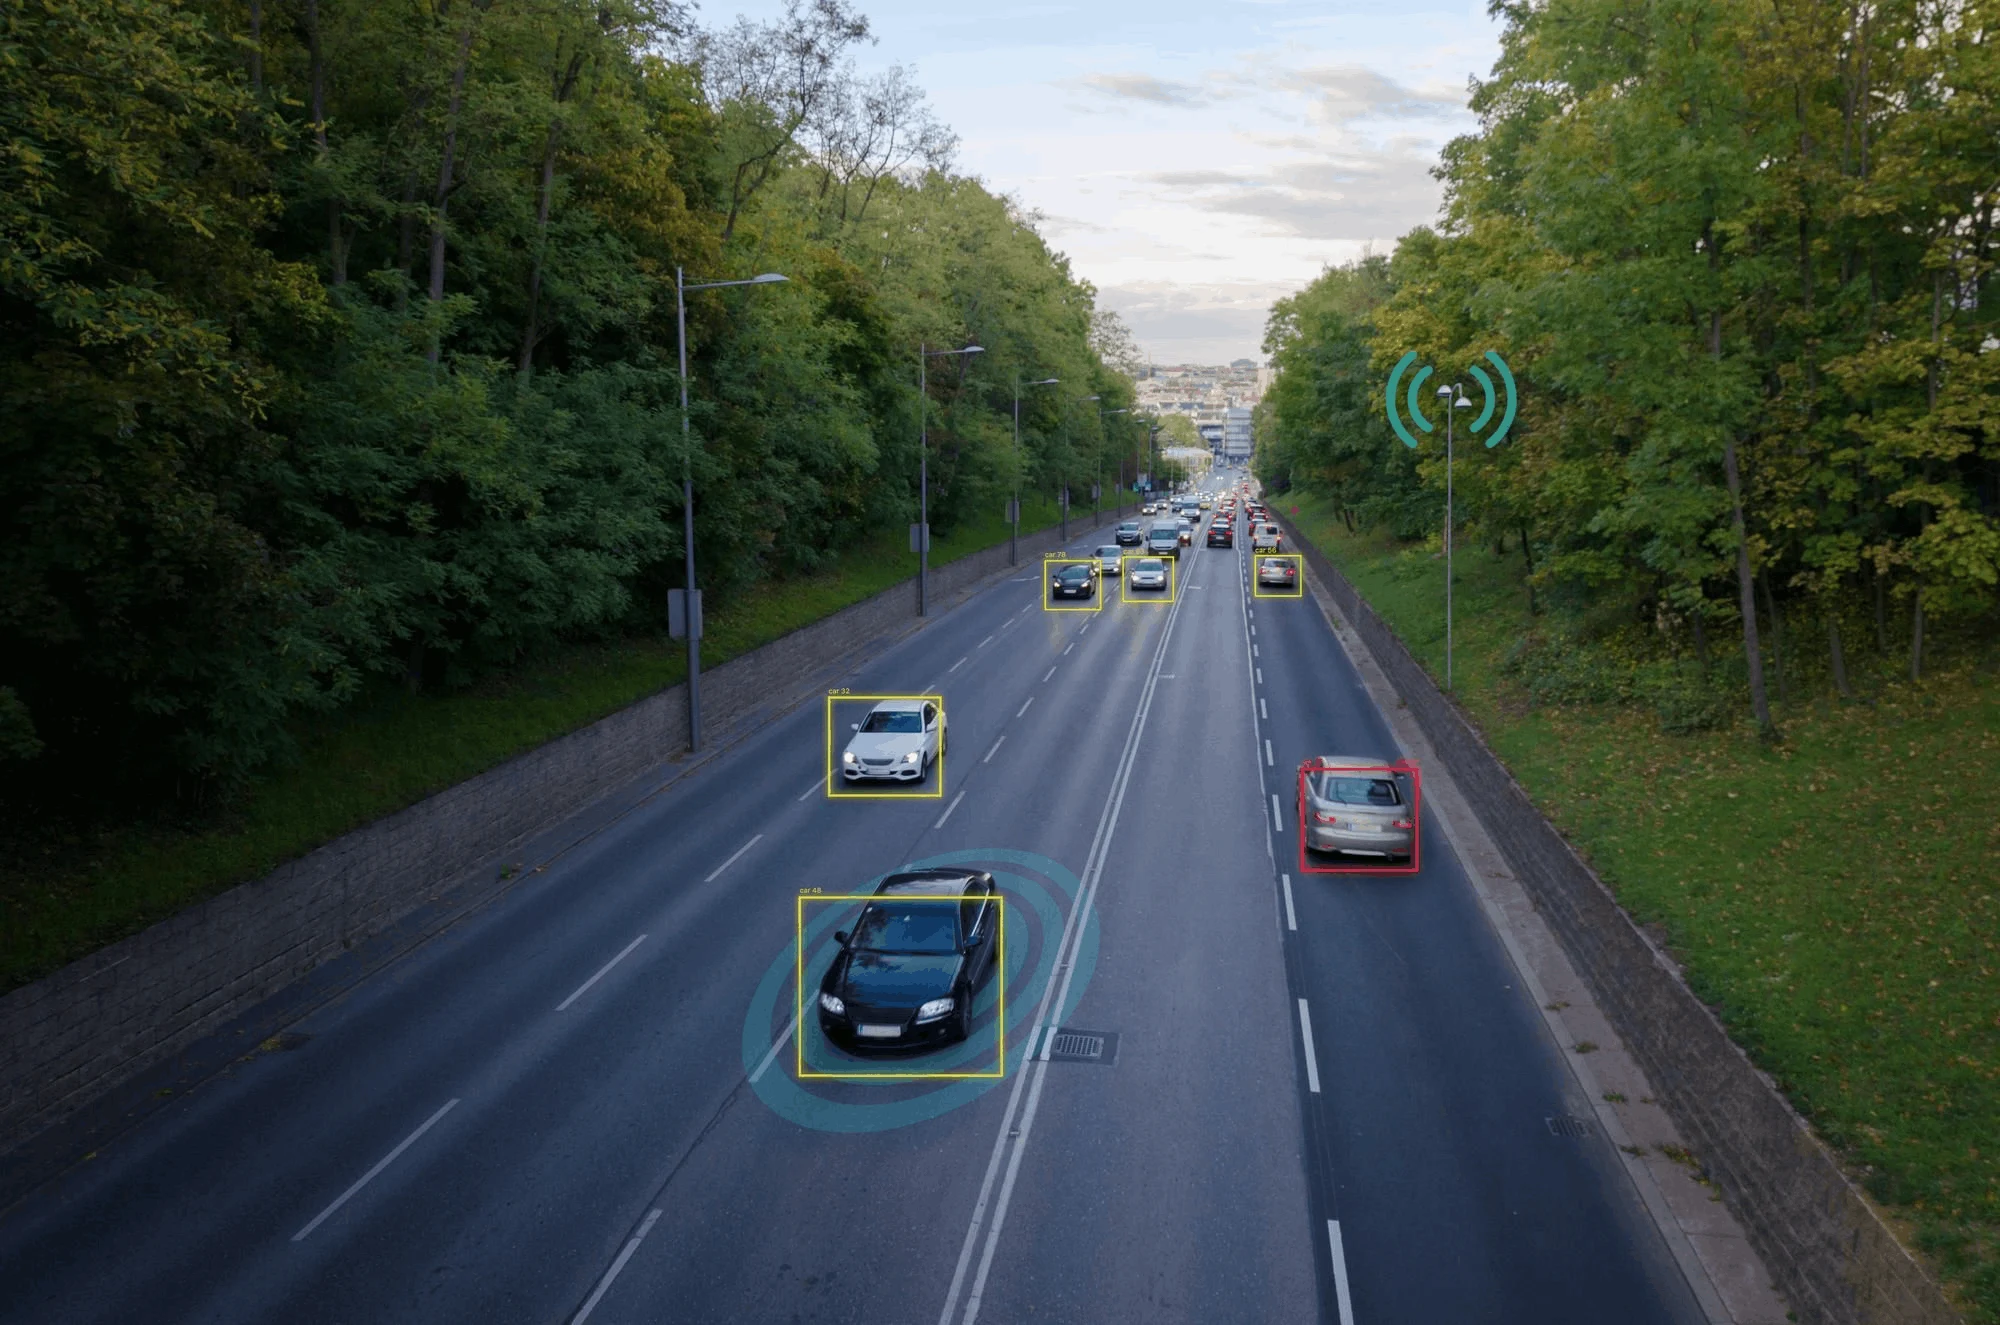
Real corridors, real flows. The junctions trafficNET monitors, the crossings it helps make safer.
Edge unit at the junction, dashboard in our EU cloud. Fastest start. Monthly billing. ISO 27001-controlled.
Deployed inside your Azure tenant. Your data residency, your compliance posture, our 24/7 operations team.
Begin with the junctions and corridors that matter most and add capabilities as you grow — connecting to your wider analytics, automation and decision-support tools via the DunavNET Innovation Studio.
Urban corridor — pilot 2025 — figures indicative
"We'd been planning a junction off manual counts taken twice a year. trafficNET showed the real turning movements and pedestrian peaks — the signal retiming we chose was completely different, and congestion dropped."
City mobility planner
Urban corridor pilot — multi-junction — Central Europe

Vehicle and pedestrian movement at junctions and along corridors — volumes, vehicle types, turning movements, pedestrian flows and congestion — mapped as patterns over time using computer vision and predictive analytics.
No. trafficNET counts, classifies and tracks movement — it does not identify individuals, read number plates, or store any personal data. Processing is done on anonymised video frames; no footage is retained.
Usually not. trafficNET is designed to work with your existing IP and CCTV camera infrastructure. If a specific junction or corridor has no coverage, we scope the additional hardware as a separate line item during the discovery call.
By surfacing the real pedestrian peaks, turning movements, and vehicle types at each junction — not estimates from periodic manual counts. Planners use that data to retime signals, redesign crossings, and prioritise interventions where the data shows they matter most.
Yes. trafficNET outputs structured counts and analytics via REST API and CSV export, and connects to signal controllers, public information displays, GIS tools, and your existing traffic management centre — no new street furniture required.
Generic counters give you totals; trafficNET gives you turning movements, vehicle types, pedestrian flows, and patterns over time — per junction, per approach. You see how the network behaves, not just how busy it was. DunavNET also runs the analytics and model tuning, not just the hardware.